Introduction
We know that xchart basically displays different statistical data on different chart types such as column chart, bar chart, line chart, pie chart etc. You can have a look at the URL http://tenxer.github.io/xcharts/ for more information. You can integrate xchart with any server side tehnology but here I will show you how to integrate xchart with Codeigniter framework.
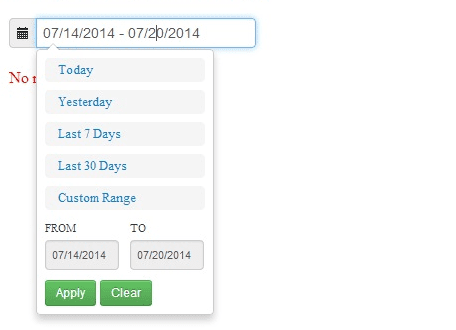
This tutorial shows step by step so that we can understand how it happens. It displays the data for site visitors log in line chart. I have also put a calendar for date-picker so that you can pick a custom range of dates and get the visitor statistics in xchart. The calendar has more features like you can select Yesterday, Last One week, Last One month etc. On mouse hover on the line chart you can see the visitors count on a particular date.
Prerequisites
PHP 7.3.5, CodeIgniter 3.1.11, jQuery, AJAX, MySQL 8.0.17, Apache HTTP Server 2.4
Create Project Directory
It’s assumed that you have setup Apache 2.4, PHP 7.3.5 and Codeigniter 3.1.11 in Windows system.
Now we will create a project root directory called codeIgniter-3.1.11-xchart under the Apache server’s htdocs folder.
Now move all the directories and files from CodeIgniter 3.1.11 framework into codeIgniter-3.1.11-xchart directory.
We may not mention the project root directory in subsequent sections and we will assume that we are talking with respect to the project root directory.
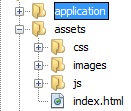
Static Resources
You need to create assets folder in parallel to application folder for putting all asset files such as js, css, images etc.
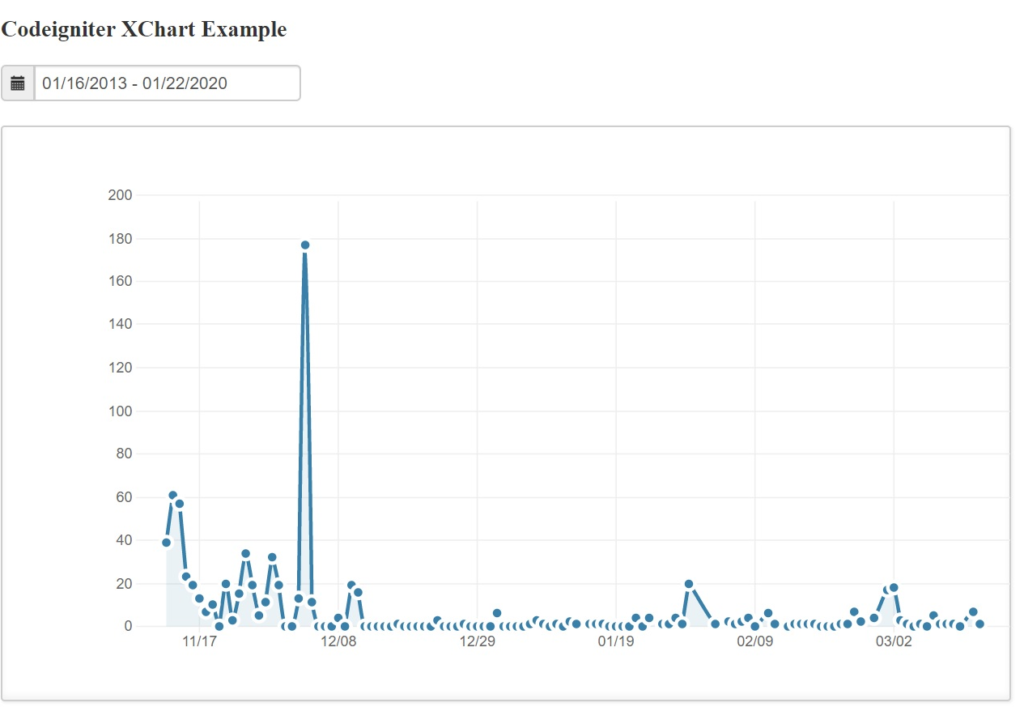
Final Output
Calendar – Date Picker
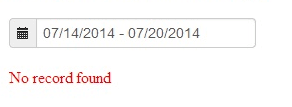
Record Not Found
Record found for the below date range
Create MySQL Table
First thing is we need to create database table from which we want to show data on XChart. In this example we will use some sample data about visitors logs.
Create a table called site_log under database roytuts in MySQL server.
CREATE TABLE IF NOT EXISTS `site_log` (
  `site_log_id` int(10) unsigned NOT NULL AUTO_INCREMENT,
  `no_of_visits` int(10) unsigned NOT NULL,
  `ip_address` varchar(20) NOT NULL,
  `requested_url` tinytext NOT NULL,
  `referer_page` tinytext NOT NULL,
  `page_name` tinytext NOT NULL,
  `query_string` tinytext NOT NULL,
  `browser` tinytext NOT NULL,
  `is_unique` tinyint(1) NOT NULL DEFAULT '0',
  `access_date` timestamp NOT NULL DEFAULT CURRENT_TIMESTAMP,
  PRIMARY KEY (`site_log_id`)
) ENGINE=InnoDB AUTO_INCREMENT=2425 DEFAULT CHARSET=utf8mb4 COLLATE=utf8mb4_0900_ai_ci;
We will also dump some data into the above table and can be found in this tutorial later at the bottom.
Database Configuration
Once you have CodeIgniter framework setup in place then configure database settings at location application/config/database.php.
Make sure to update the database configurations according to your values.
$db['default'] = array(
	'dsn'	=> '',
	'hostname' => 'localhost',
	'username' => 'root',
	'password' => 'root',
	'database' => 'roytuts',
	'dbdriver' => 'mysqli',
        ...
	'char_set' => 'utf8mb4',
	'dbcollat' => 'utf8mb4_unicode_ci',
        ...
);
Application Configurations
Modify the autoload.php file at location application/config/autoload.php to autoload certain things which will be used throughout the application.
$autoload['libraries'] = array('database');
$autoload['helper'] = array('url', 'file', 'text', 'form');
Create Model Class
Create a model which will give us the data for the chart under application/models/xchart_model.php. The below model file is pretty simple.
<?php

if (!defined('BASEPATH'))
exit('No direct script access allowed');

/**
* Description of XChart_model
*
* @author https://roytuts.com
*/
class XChart_model extends CI_Model {

	private $site_log = 'site_log';

	/**
	* get chart data
	*/
	function get_chart_data_for_visits($start_date, $end_date) {
		$sql = 'SELECT SUM(no_of_visits) total_visits, DATE(access_date) day_date
			FROM ' . $this->site_log . '
			WHERE DATE(access_date) >= ' . $this->db->escape($start_date) . '
			AND DATE(access_date) <= ' . $this->db->escape($end_date) . '
			GROUP BY DATE(access_date) ORDER BY DATE(access_date) DESC';

		$query = $this->db->query($sql);

		if ($query->num_rows() > 0) {
			$data = array();

			foreach ($query->result_array() as $key => $value) {
				$data[$key]['label'] = $value['day_date'];
				$data[$key]['value'] = $value['total_visits'];
			}

			return $data;
		}
		return NULL;
	}

}

/* End of file xchart_model.php */
/* Location: ./application/models/xchart_model.php */
Create Controller Class
Now create one controller called XChart_Controller under application/controller/xchart_controller.php with below source code.
<?php
defined('BASEPATH') OR exit('No direct script access allowed');

class XChart_controller extends CI_Controller {

	function __construct() {
		parent::__construct();

		$this->load->model('xchart_model');
		$this->load->library('form_validation');
	}

	public function index() {
		$this->load->view('xchart');
	}

	function get_chart_data() {
		if (isset($_POST['start']) AND isset($_POST['end'])) {
			$start_date = $_POST['start'];
			$end_date = $_POST['end'];

			$results = $this->xchart_model->get_chart_data_for_visits($start_date, $end_date);

			if ($results === NULL) {
				echo json_encode('No record found');
			} else {
				echo json_encode($results);
			}
		} else {
			echo json_encode('You must select date');
		}
	}
}
Configure Route
Now modify the application/config/routes.php file to configure the default routing.
$route['default_controller'] = 'xchart_controller';Create View File
Next create a view file with the following code.
<!DOCTYPE html>
<html>
<head>
<meta charset="UTF-8">
<title>XChart Example in Codeigniter </title>
<link rel="stylesheet" href="<?php echo base_url(); ?>assets/css/charts/chart.css">
<link rel="stylesheet" href="<?php echo base_url(); ?>assets/css/charts/xcharts.min.css">
<link rel="stylesheet" href="<?php echo base_url(); ?>assets/css/charts/bootstrap.min.css">
<link rel="stylesheet" href="<?php echo base_url(); ?>assets/css/daterangepicker.css">
<script src="https://code.jquery.com/jquery-3.4.1.min.js"></script>
<script src="https://code.jquery.com/ui/1.12.1/jquery-ui.min.js"></script>
<script type='text/javascript' src='<?php echo base_url(); ?>assets/js/charts/d3.v2.js'></script>
<script type='text/javascript' src='<?php echo base_url(); ?>assets/js/charts/sugar.min.js'></script>
<script type='text/javascript' src='<?php echo base_url(); ?>assets/js/charts/xcharts.min.js'></script>
<script type='text/javascript' src='<?php echo base_url(); ?>assets/js/charts/script.js'></script>
<script type='text/javascript' src='<?php echo base_url(); ?>assets/js/daterangepicker.js'></script>
</head>
<body>
	<div style="margin: 10px 0 0 10px;">
		<h3>Codeigniter XChart Example</h3>

		<form class="form-horizontal">
			<fieldset>
			<div class="input-prepend">
				<span class="add-on"><i class="icon-calendar"></i></span>
				<input type="text" name="range" id="range" />
			</div>
			</fieldset>
		</form>

		<div id="msg"></div>

		<div id="placeholder">
			<figure id="chart"></figure>
		</div>
	</div>
</body>
</html>
You can download the sample data for table site_log
Download all the files for css and js from here.
Source Code
Thanks for reading.
Thank You !
thanks !
Thanks dude! Thank u so much :*