Introduction
I will show you how to create Google chart using JSF 2. I will create here pie chart. The Google chart basically displays different statistical data on different chart types such as column chart, bar chart, line chart, pie chart etc. You can have a look at the URL https://developers.google.com/chart/ for more information.
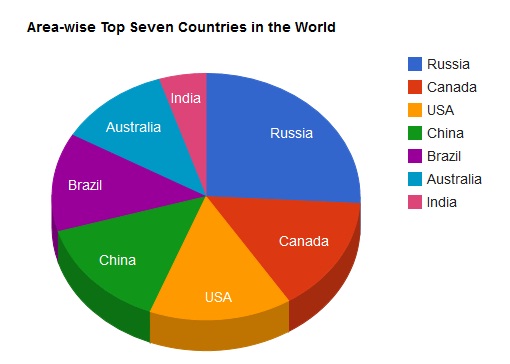
You can integrate Google chart with any server side technology but here I will show you how to integrate Google chart using JSF. This tutorial shows step by step so that you can understand how it happens. It displays the data for area-wise top seven countries in pie chart. You can also use other charts for other purposes.
In this example I have used static sample data and the actual data should come from database or other sources. You can change the source of data as per your requirements.
Prerequisites
JDK at least 1.8, JSF 2.2.20, Tomcat 9.0.24, cdi-api 2.0.SP1 (for JDK 9 or above)
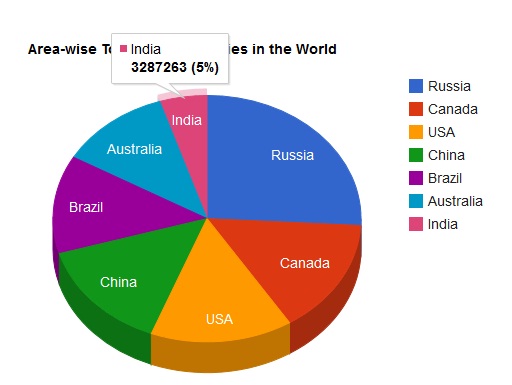
Final Results
Data on Google pie chart is shown below:
When you mouse hover on the different sections on the chart:
Project Setup
Create a maven or gradle based project in your favorite IDE or tool.
For maven based projct, use below pom.xml to include the required dependencies for your project.
<project xmlns="http://maven.apache.org/POM/4.0.0"
	xmlns:xsi="http://www.w3.org/2001/XMLSchema-instance"
	xsi:schemaLocation="http://maven.apache.org/POM/4.0.0 http://maven.apache.org/maven-v4_0_0.xsd">

	<modelVersion>4.0.0</modelVersion>
	<groupId>com.roytuts</groupId>
	<artifactId>jsf2-google-pie-chart</artifactId>
	<packaging>war</packaging>
	<version>0.0.1-SNAPSHOT</version>

	<dependencies>
		<dependency>
			<groupId>com.sun.faces</groupId>
			<artifactId>jsf-api</artifactId>
			<version>2.2.20</version>
		</dependency>

		<dependency>
			<groupId>com.sun.faces</groupId>
			<artifactId>jsf-impl</artifactId>
			<version>2.2.20</version>
		</dependency>

		<!-- for jdk 9 or above -->
		<dependency>
			<groupId>javax.enterprise</groupId>
			<artifactId>cdi-api</artifactId>
			<version>2.0.SP1</version>
		</dependency>
	</dependencies>

	<build>
		<finalName>jsf2-google-pie-chart</finalName>
		<plugins>
			<plugin>
				<groupId>org.apache.maven.plugins</groupId>
				<artifactId>maven-compiler-plugin</artifactId>
				<version>3.8.1</version>
				<configuration>
					<source>1.8</source>
					<target>1.8</target>
				</configuration>
			</plugin>
		</plugins>
	</build>
</project>
For gradle based project use the following build.gradle script:
plugins {
	id 'war'
    id 'java-library'
}

repositories {
    jcenter()
}

dependencies {
    implementation 'com.sun.faces:jsf-api:2.2.20'
    implementation 'com.sun.faces:jsf-impl:2.2.20'
    implementation 'javax.enterprise:cdi-api:2.0.SP1'
}
Deployment Descriptor
Update deployment descriptor file – web.xml – to include the required configurations.
In this file you have the central request and response handler servlet called FacesServlet which is loaded on application startup.
I have put the URL pattern and welcome file where data on pie chart will be shown.
I have put javax.faces.PROJECT_STAGE into Development to indicate that our application is currently in development mode.
<?xml version="1.0" encoding="UTF-8"?>
<web-app xmlns="http://java.sun.com/xml/ns/javaee"
	xmlns:xsi="http://www.w3.org/2001/XMLSchema-instance"
	xsi:schemaLocation="http://java.sun.com/xml/ns/javaee
          http://java.sun.com/xml/ns/javaee/web-app_3_1.xsd"
	version="3.1">
	<display-name>JSF 2 Google Pie Chart</display-name>
	<context-param>
		<param-name>javax.faces.PROJECT_STAGE</param-name>
		<param-value>Development</param-value>
	</context-param>
	<servlet>
		<servlet-name>Faces Servlet</servlet-name>
		<servlet-class>javax.faces.webapp.FacesServlet</servlet-class>
		<load-on-startup>1</load-on-startup>
	</servlet>
	<servlet-mapping>
		<servlet-name>Faces Servlet</servlet-name>
		<url-pattern>*.jsf</url-pattern>
	</servlet-mapping>
	<welcome-file-list>
		<welcome-file>chart.jsf</welcome-file>
	</welcome-file-list>
</web-app>
Pie Chart Data
Ideally data should be provided from database or any external source but for this example, I will create some sample data and will display on Google pie chart using JSF 2.
package com.roytuts.jsf2.google.chart.data;

import java.util.ArrayList;
import java.util.List;

public class PieChartData {
	private static final List<KeyValue> pieDataList;
	static {
		pieDataList = new ArrayList<PieChartData.KeyValue>();
		pieDataList.add(new KeyValue("Russia", "17098242"));
		pieDataList.add(new KeyValue("Canada", "9984670"));
		pieDataList.add(new KeyValue("USA", "9826675"));
		pieDataList.add(new KeyValue("China", "9596961"));
		pieDataList.add(new KeyValue("Brazil", "8514877"));
		pieDataList.add(new KeyValue("Australia", "7741220"));
		pieDataList.add(new KeyValue("India", "3287263"));
	}
	public static List<KeyValue> getPieDataList() {
		return pieDataList;
	}
	public static class KeyValue {
		String key;
		String value;
		public KeyValue(String key, String value) {
			super();
			this.key = key;
			this.value = value;
		}
		public String getKey() {
			return key;
		}
		public void setKey(String key) {
			this.key = key;
		}
		public String getValue() {
			return value;
		}
		public void setValue(String value) {
			this.value = value;
		}
	}
}
JSF Managed Bean
I will create JSF managed bean to handle request and response for the clients.
This managed bean will load appropriate view file to display data on the view.
package com.roytuts.jsf2.google.chart.mbean;

import java.io.Serializable;
import java.util.List;
import javax.faces.bean.ManagedBean;
import javax.faces.bean.ViewScoped;
import com.roytuts.jsf2.google.chart.data.PieChartData;
import com.roytuts.jsf2.google.chart.data.PieChartData.KeyValue;

@ViewScoped
@ManagedBean
public class PieChartMBean implements Serializable {
	private static final long serialVersionUID = 1L;
	private String pieChartData;
	private List<KeyValue> pieDataList;
	public PieChartMBean() {
		this.pieDataList = PieChartData.getPieDataList();
	}
	public String getPieChartData() {
		if (pieChartData == null || pieChartData.trim().length() <= 0) {
			populateData();
		}
		return pieChartData;
	}
	private void populateData() {
		StringBuilder stringBuilder = new StringBuilder();
		for (KeyValue pieData : pieDataList) {
			stringBuilder.append("[");
			stringBuilder.append("'");
			stringBuilder.append(pieData.getKey());
			stringBuilder.append("'");
			stringBuilder.append(",");
			stringBuilder.append(pieData.getValue());
			stringBuilder.append("]");
			stringBuilder.append(",");
		}
		pieChartData = stringBuilder.toString().substring(0, stringBuilder.toString().length() - 1);
	}
}
View File
Create a view called chart.xhtml which will render the Google Pie Chart with the data from JSF Managed Bean.
In view you can initialize data to chart in two ways:
var data = new google.visualization.DataTable();
data.addColumn('string', 'Topping');
data.addColumn('number', 'Slices');
data.addRows([
	#{pieChartMBean.pieChartData}
]);
or
var data = google.visualization.arrayToDataTable([
	['Country', 'Area(square km)'],
	#{pieChartMBean.pieChartData}
]);
In the above code, we simply call the backing bean property and add the data to the Google Pie Chart.
The source code for the view file is given below:
<?xml version='1.0' encoding='UTF-8' ?>
<!DOCTYPE html PUBLIC "-//W3C//DTD XHTML 1.0 Transitional//EN" "http://www.w3.org/TR/xhtml1/DTD/xhtml1-transitional.dtd">
<html xmlns="http://www.w3.org/1999/xhtml"
xmlns:h="http://xmlns.jcp.org/jsf/html"
xmlns:f="http://xmlns.jcp.org/jsf/core"
xmlns:ui="http://xmlns.jcp.org/jsf/facelets">
<h:head>
	<title>Google Chart - JSF 2</title>
	<script type="text/javascript" src="https://www.gstatic.com/charts/loader.js"></script>
	<script type="text/javascript">
		// Load the Visualization API and the piechart package.
		google.charts.load('current', {'packages':['corechart']});
		/* google.load('visualization', '1.0', {
			'packages' : [ 'corechart' ]
		}); */
		// Set a callback to run when the Google Visualization API is loaded.
		google.charts.setOnLoadCallback(drawChart);
			// Callback that creates and populates a data table,
			// instantiates the pie chart, passes in the data and
			// draws it.
		function drawChart() {
			// Create the data table.
			var data = google.visualization.arrayToDataTable([
				[ 'Country', 'Area(square km)' ],
				#{pieChartMBean.pieChartData}
			]);
			// Set chart options
			var options = {
				'title' : 'Area-wise Top Seven Countries in the World',
				is3D : true,
				pieSliceText : 'label',
				tooltip : {
					showColorCode : true
				},
				'width' : 900,
				'height' : 500
			};
			// Instantiate and draw our chart, passing in some options.
			var chart = new google.visualization.PieChart(document.getElementById('chart_div'));
			chart.draw(data, options);
		}
	</script>
</h:head>
<h:body>
	<div style="width: 600px;">
		<div id="chart_div"></div>
	</div>
</h:body>
</html>
Testing the Application
Now hit the URL http://localhost:8080/jsf2-google-pie-chart/ in the browser and you will see the exact output as shown in the image in Final Results section above.
Source Code
Thanks for reading.