Introduction
Here you will see a simple example on profiling Codeigniter application. The Codeigniter’s Profiler class displays benchmark results, queries you have run and POST data at the bottom of the page. This information may be useful in the development environment for debugging and optimization of your application.
Related Posts:
Prerequisites
Codeigniter 3.1.11, PHP 7.4.3, Apache 2.4
Enabling Profiler
The Codeigniter’s Profiler class doe not need to be loaded explicitly and it is loaded automatically when you enable the profiler. You can put the below line anywhere within your controller methods to enable profiling for Codeigniter application.
$this->output->enable_profiler(TRUE);To disable the profiler you need to use:
$this->output->enable_profiler(FALSE);Enabling and Disabling Profiler Sections
All sections of profiler are enabled by default. So each section of Profiler data can be enabled or disabled by setting a corresponding config variable to TRUE or FALSE. This can be done one of two ways.
First you can enable profiler sections in application/config/profiler.php file as shown below:
$config['config']          = TRUE;
$config['queries']         = FALSE;
Second you can enable in controller method:
$sections = array(
        'config'  => TRUE,
        'queries' => TRUE
);

$this->output->set_profiler_sections($sections);
Now if you have enabled profiler sections in profiler.php file and later you want to override any profiler section, then you can always do it in your controller method.
So in the above example, the controller method will enable profiler section for queries that was disabled in profiler.php file.
Project Directory
Create a project directory called codeIgniter-profiling under your Apache’s htdocs directory.
Now move all the directories and files from CodeIgniter 3.1.11 framework into codeIgniter-profiling directory.
I may not mention the project root directory in subsequent sections and I will assume that I am talking with respect to the project root directory.
Working with Profiling
Profiling – Enabling All Sections
By default all profiler sections are enabled. So you will see information for all profiler sections.
Controller Class
I have enabled profiling for our application in controller class application/controllers/Profiling.php.
<?php
defined('BASEPATH') OR exit('No direct script access allowed');

class Profiling extends CI_Controller {

	public function index()	{
		$this->output->enable_profiler(TRUE);
		$this->load->view('profiling');
	}
}
View File
The view file is application/views/profiling.php with the following source code.
<?php
defined('BASEPATH') OR exit('No direct script access allowed');
?><!DOCTYPE html>
<html lang="en">
<head>
	<meta charset="utf-8">
	<title>Welcome to CodeIgniter Profiling</title>

	<style type="text/css">

	::selection { background-color: #E13300; color: white; }
	::-moz-selection { background-color: #E13300; color: white; }

	body {
		background-color: #fff;
		margin: 40px;
		font: 13px/20px normal Helvetica, Arial, sans-serif;
		color: #4F5155;
	}

	a {
		color: #003399;
		background-color: transparent;
		font-weight: normal;
	}

	h1 {
		color: #444;
		background-color: transparent;
		border-bottom: 1px solid #D0D0D0;
		font-size: 19px;
		font-weight: normal;
		margin: 0 0 14px 0;
		padding: 14px 15px 10px 15px;
	}

	code {
		font-family: Consolas, Monaco, Courier New, Courier, monospace;
		font-size: 12px;
		background-color: #f9f9f9;
		border: 1px solid #D0D0D0;
		color: #002166;
		display: block;
		margin: 14px 0 14px 0;
		padding: 12px 10px 12px 10px;
	}

	#body {
		margin: 0 15px 0 15px;
	}

	p.footer {
		text-align: right;
		font-size: 11px;
		border-top: 1px solid #D0D0D0;
		line-height: 32px;
		padding: 0 10px 0 10px;
		margin: 20px 0 0 0;
	}

	#container {
		margin: 10px;
		border: 1px solid #D0D0D0;
		box-shadow: 0 0 8px #D0D0D0;
	}
	</style>
</head>
<body>

<div id="container">
	<h1>Welcome to CodeIgniter Profiling!</h1>

	<div id="body">
		<p>At the bottom of this page you will see benchmark results, queries you have run, and $_POST data. This information may help you during development for debugging and optimization.</p>
	</div>

	<p class="footer">Page rendered in <strong>{elapsed_time}</strong> seconds. <?php echo  (ENVIRONMENT === 'development') ?  'CodeIgniter Version <strong>' . CI_VERSION . '</strong>' : '' ?></p>
</div>

</body>
</html>
Configure Route
Point to the correct controller in application/config/routes.php.
$route['default_controller'] = 'profiling';Testing the Application
Now hit the URL http://localhost/codeIgniter-profiling/ in the browser, you will get below output:
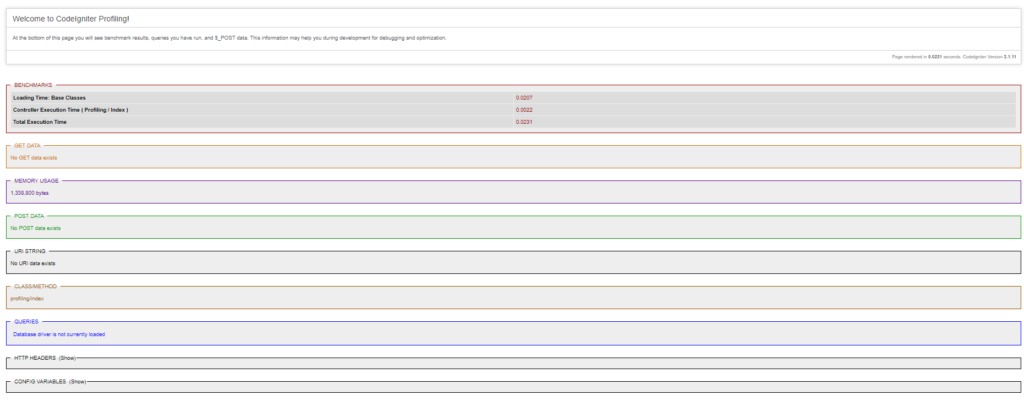
Profiling – Disable through Configuration
Configuration
Let’s say your config file (application/config/profiler.php) has below configurations to disable profile sections – memory usage and config.
$config['config'] = FALSE;
$config['memory_usage'] = FALSE;
Rest of the source code remains same.
Controller, View
Testing the Application
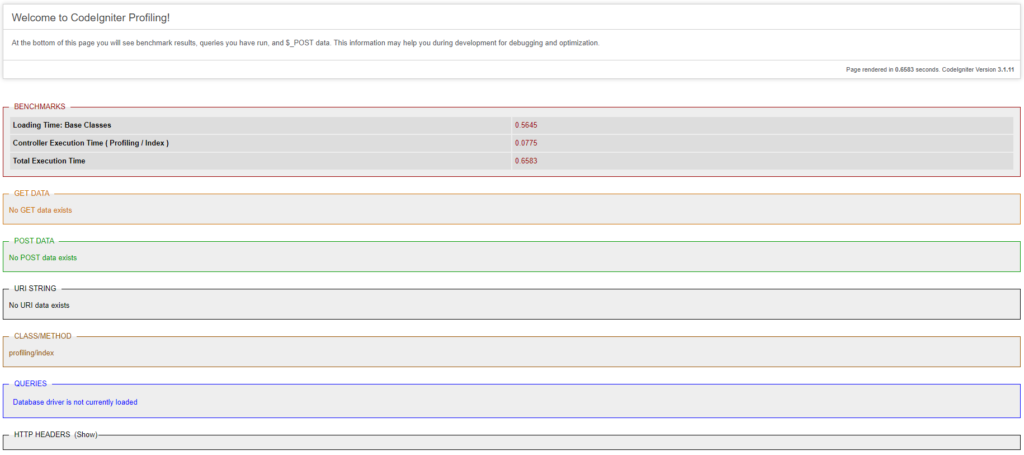
Hit the same URL again, you should see the following output without information for config and memory usage.
Profiling – Disable through Controller
In the above I have seen how to disable profiler sections using configuration file. Now I will see how to disable profiler sections using Controller class method.
Controller’s index method
Modify the index() function of the Profiling Controller as shown below:
public function index()	{
	$this->output->enable_profiler(TRUE);

	$sections = array(
		'config'  => FALSE,
		'memory_usage' => FALSE
	);

	$this->output->set_profiler_sections($sections);

	$this->load->view('profiling');
}
In the above method I have disabled the config and memory usage information in the same way I disabled through configurations.
Rest of the source code remains same.
Profiler, View
Testing the Application
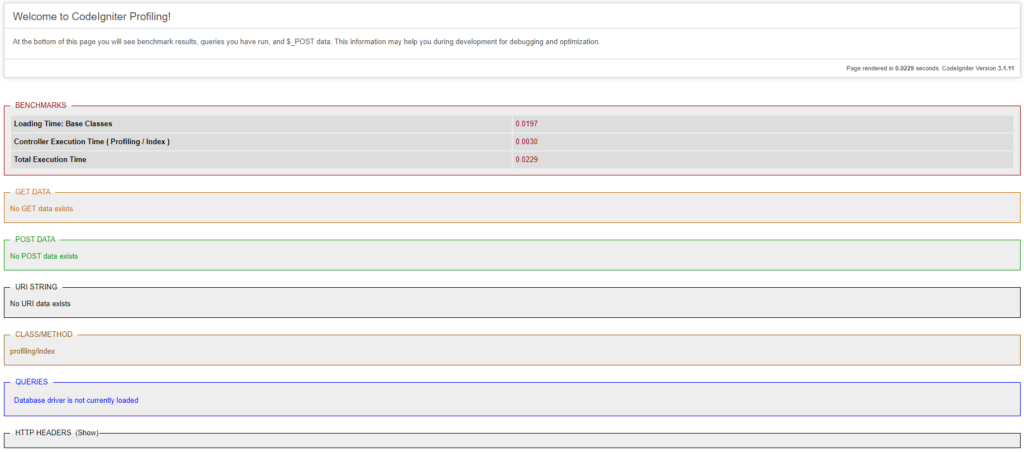
Hit the same URL in the browser, you will see the same output as above without config and memory usage information.
Overriding Profiler Sections
Now you will see how to override profiler section(s) in Controller method, that was/were disabled through configuration.
profiler.php
Let’s say you have disabled config and memory usage through profiler configuration file (application/config/profiler.php) as shown below:
$config['config'] = FALSE;
$config['memory_usage'] = FALSE;
Controller – Profiling
I already have modified two profiler sections through above configuration file, but later I thought that I need to disable only config section but want to enable memory usage section. Then you can override memory usage section in Controller’s method as shown below:
public function index()	{
	$this->output->enable_profiler(TRUE);

	$sections = array(
		'memory_usage' => TRUE
	);

	$this->output->set_profiler_sections($sections);

	$this->load->view('profiling');
}
Testing the Application
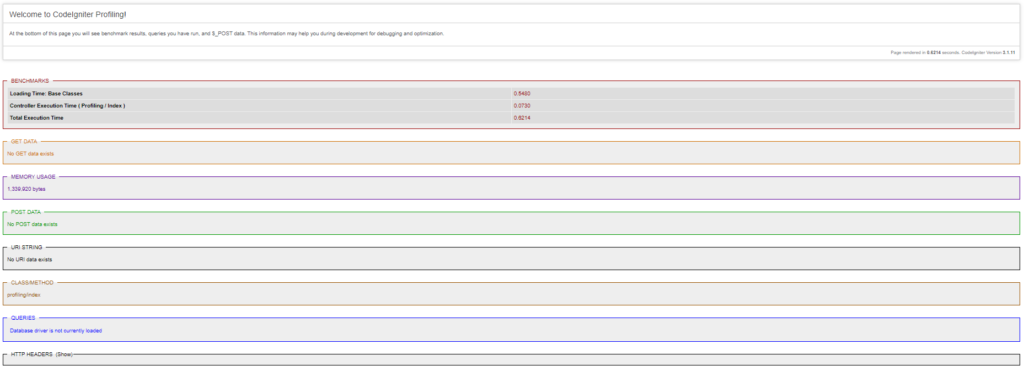
Now hit the same URL in the browser, you will see the following output with memory usage information included.
That’s all. Hope you got an idea on Profiling Codeigniter Applications.
Source Code
Thanks for reading.